
Live Console
See the whole trade before you take it
The Live Console is a trading screen for NinjaTrader that runs in your browser: a live chart fed by your own NinjaTrader, an order bar on the chart, and every account copying what you send. Around it sit the facts that good decisions are made of — where the levels are, what the session is doing, what your bracket really asks of you, what a stop-out would cost each account — so the next click is a decision rather than a reflex.
01 — Trade from the chart
Point at a price. Trade it.
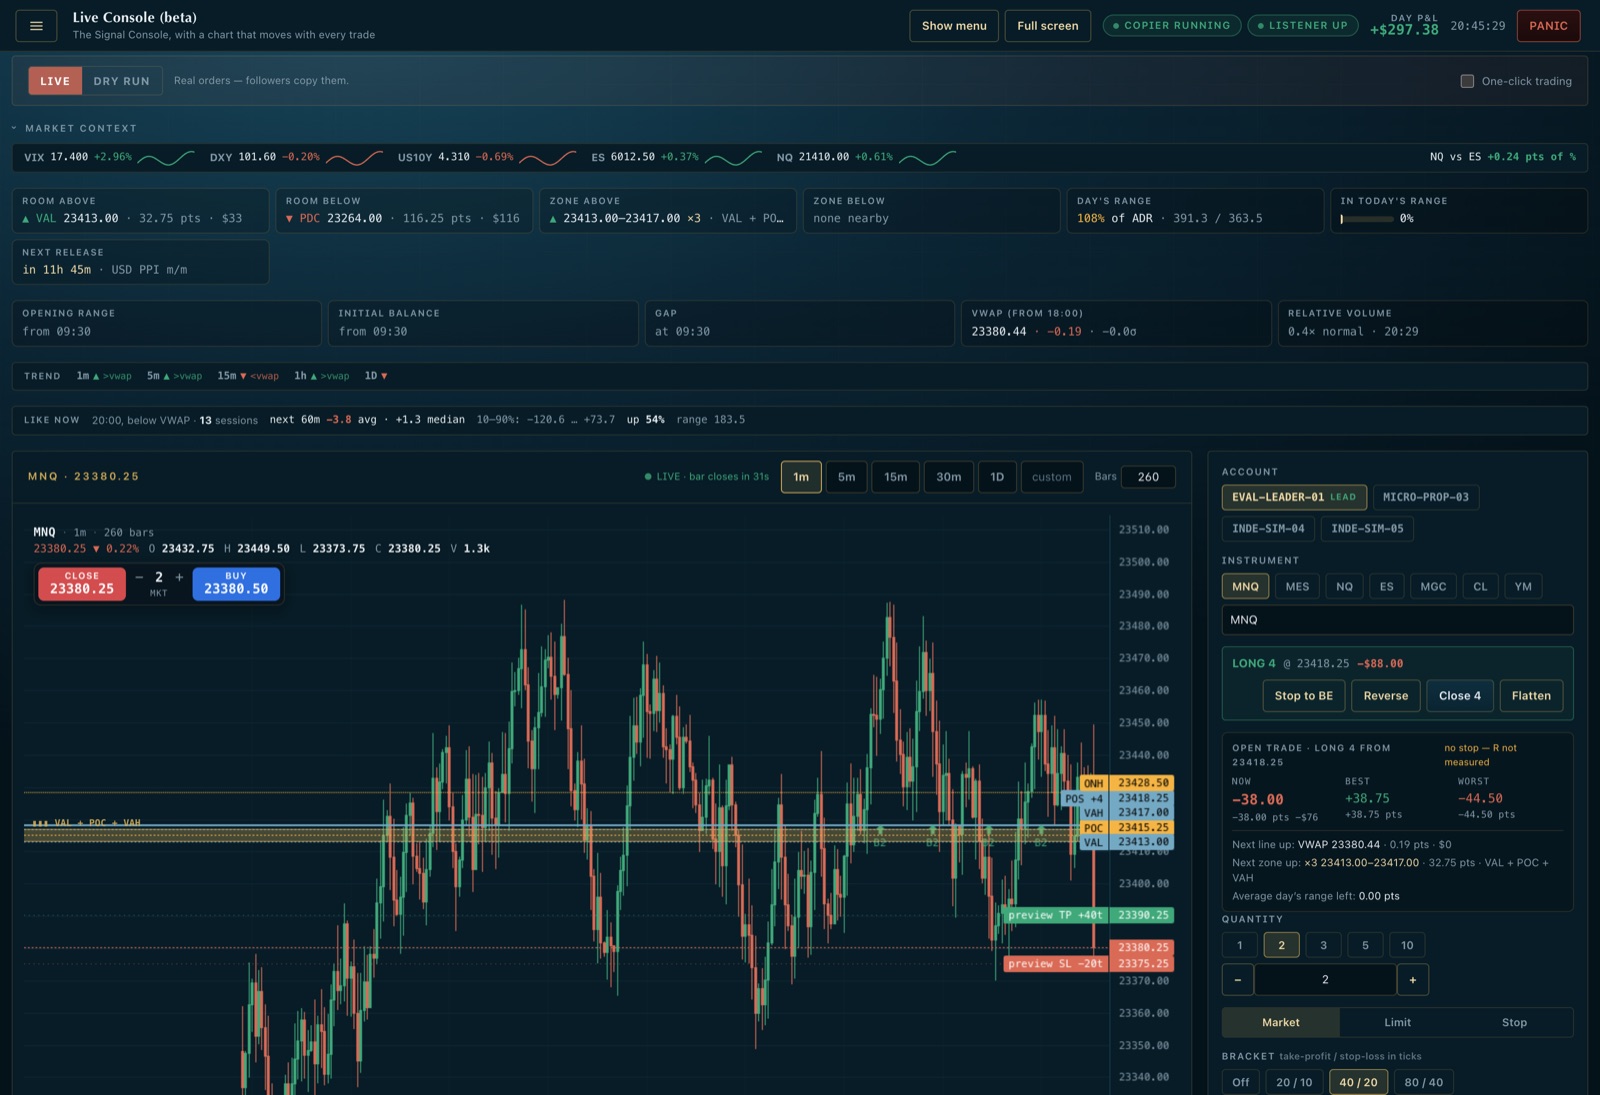
The chart moves with every trade NinjaTrader streams — no second data subscription — and an order sent from it goes to your leader, so every follower copies it, sized for each account.
An order bar on the chart
All plansSell, the size and Buy float over the chart, with the live bid and ask, sending with the ticket's order type and bracket. On a phone the chart fills the screen with the ticket below.
Right-click to trade
All plansRight-click — long-press on a phone — to buy or sell at that price as a limit or a stop, sized and bracketed from the ticket. In a trade, right-click where you want out to place its target or stop; drag a working order to move it.
Brackets you can see
All plansPick a stop and target from a preset or type your own; both are drawn on the chart before the order goes. Add a second target, break-even and a trailing stop.
A key for every action
All plansBuy, sell, close, reverse, flatten and stop to break-even from the keyboard — break-even moves every follower's stop too, each to its own entry. Each key asks for a second press unless you switch on one-click trading.
Your chart, your way
All plansAny timeframe up to 1,000 bars, EMA, SMA, Bollinger, VWAP, RSI, MACD and ATR, and full screen with the menu hidden. The chart and the ticket fill the screen.
Live or dry run
All plansIn dry run every order is checked by the copier without being placed — the safe way to learn the console, or to rehearse a plan before the open.
02 — The market around you
Everything a second monitor was for, over the chart
Levels, zones and the state of the session are drawn on the chart and summarised in a few slim rows above it. The context rows fold away with one click, and none of them is a signal: they are the facts you would otherwise look up in three other windows.
Key levels on the chart
All plansYesterday's high, low and close, the overnight range, VWAP and the value area, with the session's red-folder releases marked where they fall.
Confluence zones
ProWhere several levels sit within a few ticks of each other, the chart shades the zone and says how many agree — and names the nearest zone above and below.
Market context
ProRoom to the nearest level above and below — in points, and in dollars at the size on your ticket — how much of an average day's range is used, and how long until the next release.
Session structure
ProThe opening range and initial balance and whether price has left them, today's gap and how much has filled, VWAP with its bands, and volume against normal for the time of day.
Every timeframe in one line
ProWhether 1, 5 and 15 minutes, the hour and the day are trending up, down or neither — each against its 20-bar average and its VWAP.
The rest of the market
ProVIX, the dollar index, the 10-year yield, ES and NQ with their change on the day and a small chart each, and whether NQ is leading or lagging ES.
One bias reading from every angle
ProTrend, momentum, VWAP, other markets and order flow each cast a weighted vote into one bullish, bearish or neutral reading. Every vote is visible in its table, a factor with no data drops out rather than skewing the result, and you can see how often each reading was followed by a move its way.
03 — Before you press buy
The questions a good trade answers first
What does this bracket need to work? What happens to every account if it stops out? What has the market usually done from here? Is this one of my trades? The ticket answers each before anything is sent.
What your bracket really asks of you
ProThe reward-to-risk, the win rate that breaks even at it, and the levels standing between your entry and the target or the stop — for a long and for a short.
What a stop-out would do
ProEvery account the order reaches — yours and each follower — with its size, the dollars at risk and what would be left above its drawdown floor or daily limit. An order that would breach one is flagged before it goes.
What usually happened next
ProPast sessions that looked like this one — the same half hour, the same side of VWAP and the opening range, the same kind of gap — and what price did over the next hour: the average, the spread and how often it rose. From your own NinjaTrader history.
Your rules, on every order
ProWrite the rules you trade by. The ticket checks the ones it can see — with the trend, not into a zone, no release coming, a stop set — and you tick the rest. Over time you see your results when you followed them against when you did not.
Tag the setup as you send
ProName the setup on the ticket — “VWAP reclaim”, “opening drive” — and every journal line of the trade carries it, so the journal can show which setups pay and which only feel like they do.
04 — While you are in it
Hold, scale or get out — on numbers
Your open trade, in R
ProP&L in R against the stop it started with, the best and worst it has been since the entry, and the next level and zone in its direction.
Your position, one tap away
All plansThe open position sits above the order buttons with its P&L; one tap closes, reverses or flattens it, or moves the stop to break-even on every account.
Alerts at your price
ProRight-click a price and get a phone and Telegram alert when the market trades there. Your copier watches the price, so you can close the dashboard and step away.
05 — After the session
Get better at the trades you actually take
Your own trades are the best teacher you have, if something reads them. Meridian replays the session, prices your habits and shows what stepping in really cost.
Replay, then practise
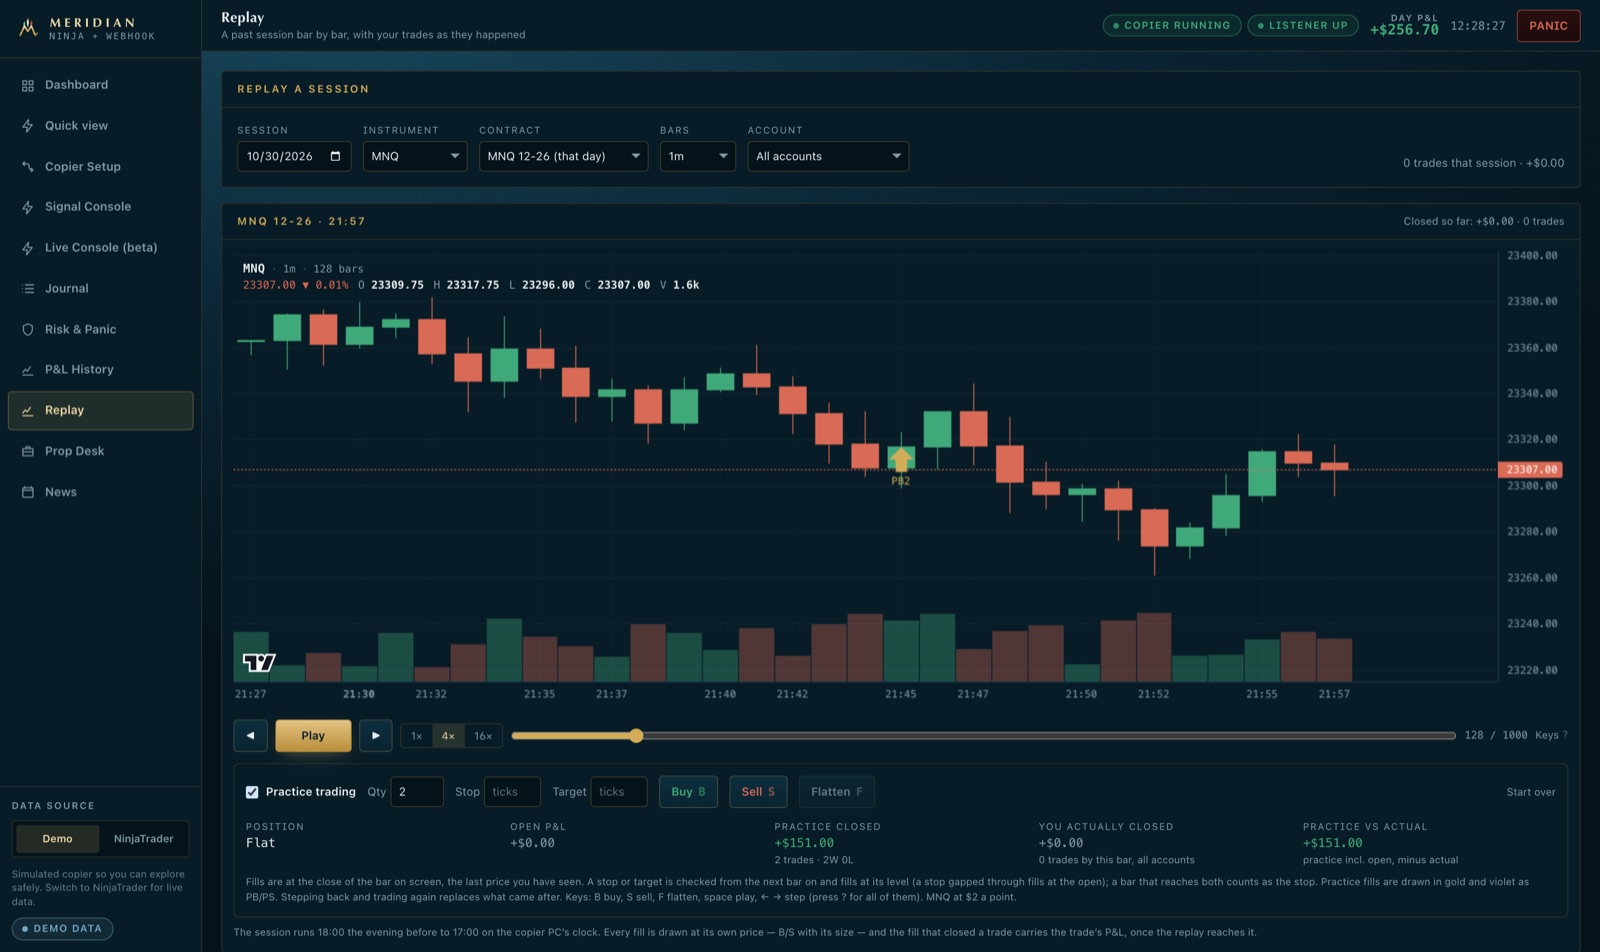
All plansPlay back any past session bar by bar at up to sixteen times speed with every fill on the chart, then trade it again on paper and compare the result with what you actually made.
Best and worst moments
All plansFor every trade, how far it went against you before it worked, and how much more it ran after you closed it — the evidence for where stops and targets belong.
Rule simulator
All plansWould a daily loss limit, a trade cap or skipping Fridays have helped? Your real trades replayed through any rule, next to what actually happened.
Patterns that cost you money
ProLate entries, trading on after losses, jumping back in after a loser, sizing up — each priced from your own trades, with the rule that stops it switched on in one tap.
What your overrides cost
ProClose a TradingView strategy's trade by hand and Meridian compares it with the strategy's own exit, so you see in dollars whether stepping in helps or hurts.
A journal that keeps itself
All plansEvery order, fill and refusal is written down as it happens, with the setup you tagged and the rules you followed — nothing to fill in at the end of the day.
06 — Under the same rules
A faster way to trade is not a way around your limits
An order from the console passes the same daily limits, drawdown floor, contract and exposure caps, news guard and discipline rules as a TradingView alert. Nothing typed by hand gets around them. How prop risk is managed.
Everything on this page is information to weigh, not advice: Meridian never tells you what to trade.